Shimamura’s share price had underperformed the retail sector median by 86% over a ten-year period when we first introduced it as an ideal turnaround candidate. The stock subsequently outperformed the Topix retail sector index by 93% over the next 22 months. This report was originally published on July 13, 2020, for Jefferies research. It has been reformatted to match the Tokyo Turnaround Letter style, which eliminates a lot of the redundant gibberish required by most sell-side firms and gets straight to the point. All data and forecasts are as in their original form, which turned out to be overly conservative.
Shimamura was the ideal turnaround stock. It had underperformed consistently and quite badly for years. Sell side coverage had almost stopped. But the company’s cash flow and liquidity were still extraordinarily robust, and its core competitive advantages in distribution and logistics were all undamaged. Then there was a change in management and a change in strategy. We were able to explain why the changes mattered and why we expected them to work, while the street remained overly skeptical and the stock ludicrously undervalued.
To download a PDF version of this report, please click here.
Out of the Hole At Last
Shimamura’s share price has underperformed the retail sector median by 86% since 2010, and by 49% in the past three years. Though it is still Japan’s second largest apparel retailer, most sell-side analysts have abandoned coverage.
The cynicism is well earned. Shimamura’s same store sales began to underperform the apparel sector average in 2016 and have declined without interruption since early 2017. But now, for three consecutive months, same store sales have outperformed peers and investors are suddenly forced to contemplate whether this is a fluke, cause by low hurdle rates and ephemeral outside forces, or a sign that Shimamura could be on the brink of one of the most exciting turn-around stories the Japanese retail sector in decades.
We think the changes are real, that they will prove persistent, and that the consensus is still completely oblivious.
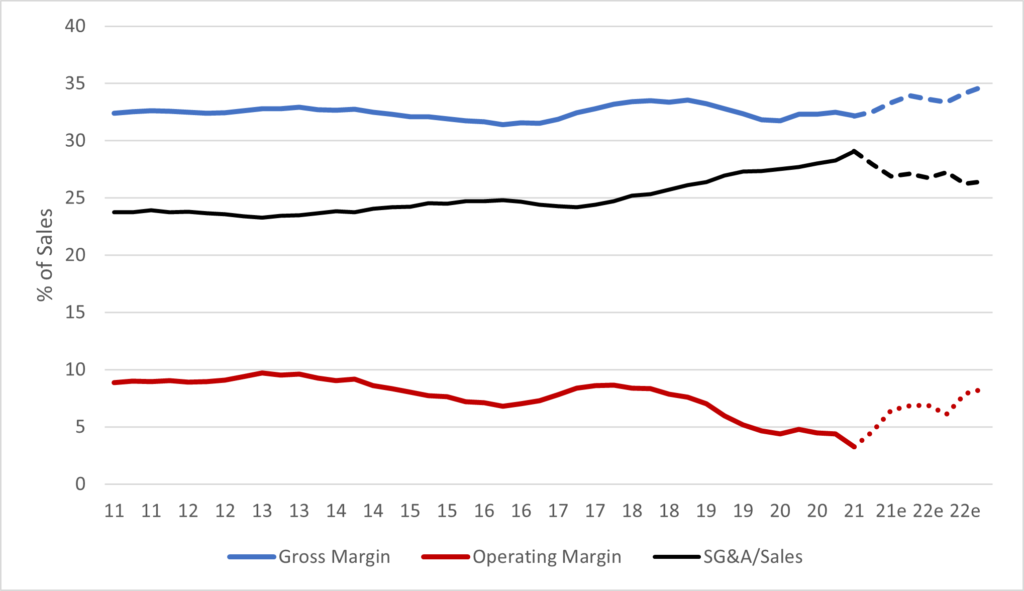
Operating Margin Components (4qtr Totals)
Azabu Research, company data
Whenever we look at a potential turnaround investment, we ask six key questions. Shimamura offers a rare case in which we believe we can answer all six with resounding satisfaction.
- Who needs this? Companies that fall into trouble need to have a core strength that is worth saving. Otherwise, they won’t be able to recruit the talent or the outside help that they need to fix the parts that are broken. In Shimamura’s case, the company has an unparalleled ability to deliver casual apparel at the lowest cost per unit. No one else comes close, not even its much larger rival Fast Retailing. This strength comes from an unparalleled distribution network that cannot easily be replaced or replicated, and it’s the kind of pricing power is not just worth saving: it is essential to a functioning apparel market. If Shimamura simply shut down and stop operating, someone would probably be willing to pay more for the assets on the private market than what they are currently trading at in the public market.
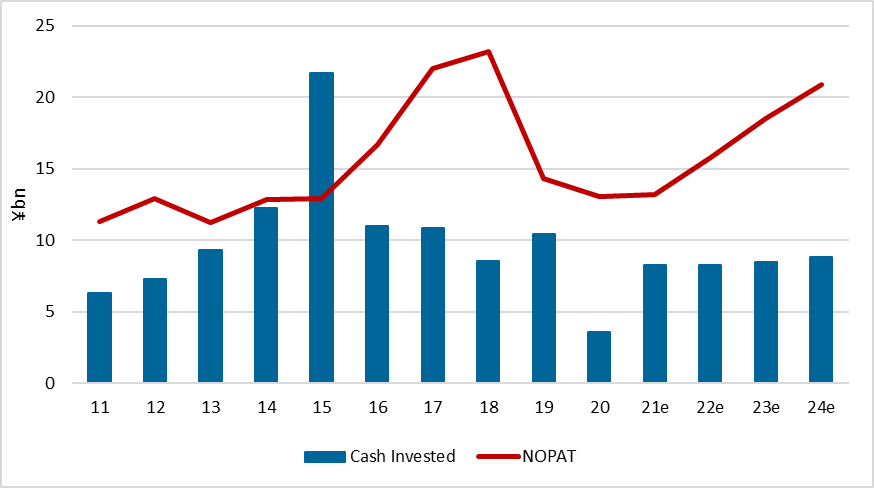
- Do they have staying power? Turn arounds usually cost money, and usually take time; either of which a company in trouble can easily run out of before the turn around can even begin. In Shimamura’s case, in its worst year, cash flow from operations was twice its annual capital expenditure requirements. Cash and equivalents on the balance sheet exceed 13x annual requirements.
- Whose running it? Generally, we don’t want the turnaround to be managed by the same people who ran it into the ground. In Shimamura’s case, we have a surprisingly strong and abrupt change at the top, and possibly more importantly, an influx of new merchandising talent through outside consultants. We don’t think the market has paid nearly enough attention to the value of the input from the consultants, which we regard as the true game changer. Without this input, we don’t think Shimamura would have been able or willing to recruit the talent needed resuscitate the merchandise assortments.
- What’s the Plan? We still need to identify the factors that led to the company’s demise and to see that these can and will be changed. Management has identified 10 changes that they are already making to improve spend per customer, improve initial mark-up ratios, reduce mark-down losses, and eliminate waste. In our view, this is a massive amount of change, and every one of the 10 points of the plan is important. Many of them are already producing results. We think CAGR in OP will accelerate to 16% on 4% in sales in the next three years, compared to a 22% annual decline in OP on a 3% annual decline in sales during the 3 previous years.
- What’s the External Environment Like? Its always good to have the wind at your back, but it is especially difficult to turn a company around if end-user demand is weak. In Shimamura’s case, the pandemic has created a windfall opportunity for Shimamura. The response to Covid-19 is leading to a change in consumer preferences for low-priced, casual apparel sold in neighborhood locations. Shimamura dominates this space.
- Who knows about it? Recovery stocks achieve their greatest returns before very many people know that a recovery is even possible. Shimamura trades at 0.7x book value per share. Trading below book in Japan is often a sign that the market thinks bankruptcy is at least a possibility. In Shimamura’s case, default on debt is impossible because there isn’t any debt, and its cash conversion cycle is 34 days. The company has enough cash to pay its bills for more than 400 days without a single item being sold. It is hard to imagine a scenario in which Shimamura defaults on any obligations. So, by extension, it is safe to say, the company’s staying power is not well appreciated.
Who Needs This?
The most important question to ask before attempting any analysis of any turn-around situation is always, who would care if the company disappeared? If the answer is “no one,” you should probably not waste any more time on the idea. Many analysts believe that Shimamura’s problems are unsolvable; gross margins are too low to build a viable e-commerce channel, and store opening opportunities were long ago exhausted. Management doesn’t have the design and marketing skills needed to compete with modern fashion apparel retailers.
These problems are all real, but analysts make a huge mistake, in our view, when they take this analysis a step further and claim that no one needs Shimamura. Shimamura is still the second largest apparel retailer in Japan and still operates more than 1,400 stores nationwide. In our estimate, more than 1,100 of these stores are highly profitable.
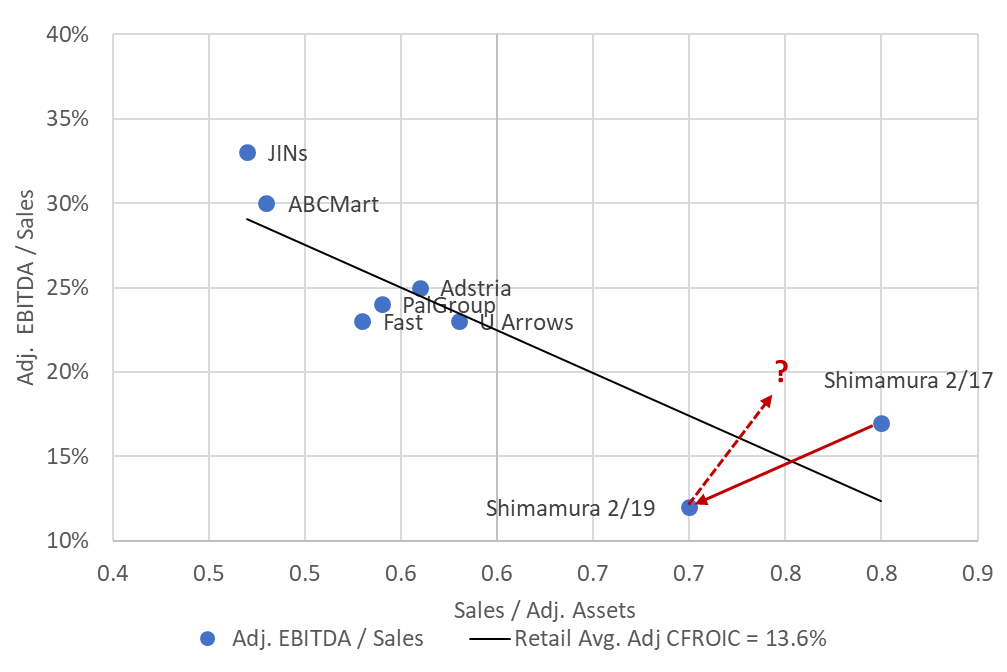
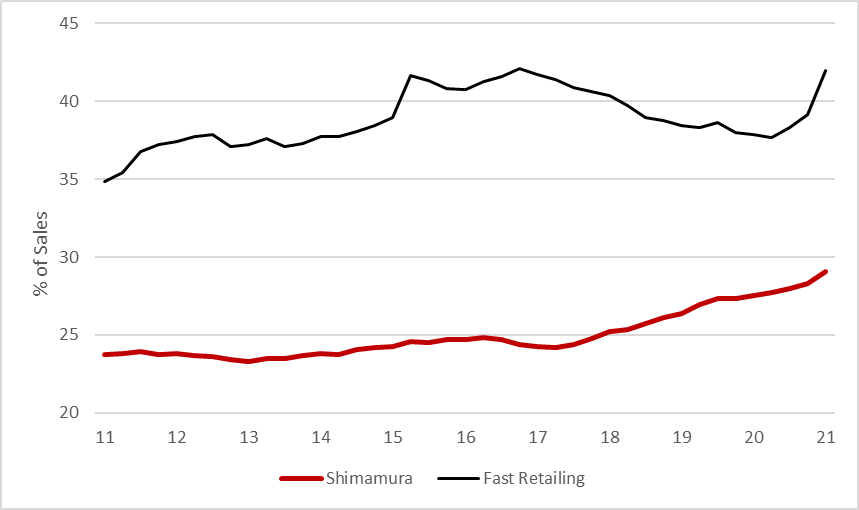
These are not just a bunch of randomly assembled buildings. Shimamura’s stores achieve by far the industry’s lowest operating costs thanks to a distribution system that channels inventories directly from factories in China to the stores without ever touching human hands. While other retailers employ armies of staff to keep the stores clean and an aggressive exploitation of anomalies in the Japanese real estate market that allows Shimamura to rent space for 10% to 20% less than almost any other retailer. If this business were to ever disappear, someone would need to replace it.
Components of CFROI: Shimamura vs. Peers
Source: Azabu Research, company data
Shimamura undercuts the prices of rival retailers by:
- Positioning most of its stores near residential districts where young mothers live. Most of Shimamura’s customers arrive by foot or by bicycle, so there is no need to use public transportation.
- Exploiting inefficiencies in the neighborhood real estate markets than do not exist in more traditional retail locations.
- Enabling most merchandise to travel from factory directly to the stores without ever being touched by human hands, eliminating thousands of man-hours in packaging, distribution, and sorting merchandise. The only humans within the entire system are the truck drivers.
- Accepting the lowest gross margins in the apparel industry, passing on its considerable buying power to consumers.
Shimamura employs about 130 buyers who interact with about 700 suppliers to centrally plan and purchases all the merchandise. Although Shimamura busy most of its merchandise indirectly, through wholesalers, most goods are delivered directly form the factories to Shimamura’s warehouses, which then automatically sort and deliver goods with no human involvement other than the truck drivers. The use of wholesalers adds a few percentage points to the cost of goods but reduces the company’s exposure to currency fluctuations and greatly improves the company’s inventory turnover. Shimamura’s outlets carry as many as 30,000 items, in a space that rival Fast Retailing might carry only 1,000 items. Yet, the company’s central databases are precise enough and fast enough to enable the company to transfer inventory between outlets daily, and to price the merchandise to optimize turnover in each climate zone.
SG&A / Sales
Source: Azabu Research, company data
The next most important question to ask is: “Does the company have enough resources to finish the job?” Turnarounds sometimes take more time than expected and weak companies can run out of resources before the job is finished. The company has no debt, and even if we capitalize leases, about 60% of adjusted assets are still financed with equity. Liquid assets consistently account for more than 20% of total adjusted assets and currently amount to about 5x the company’s annual cash requirements for capital expenditures. The company’s cash conversion cycle was only 32 days before the pandemic and was only 34 days in the year to 2/20.
Despite the first quarter decline in cash flows caused by the coronavirus outbreak and increased investments to start up the e-commerce platform, the company should still end the year with almost as much cash as it started with. This company will probably never lack the resources needed to spend whatever it needs to achieve the recovery it is aiming for.
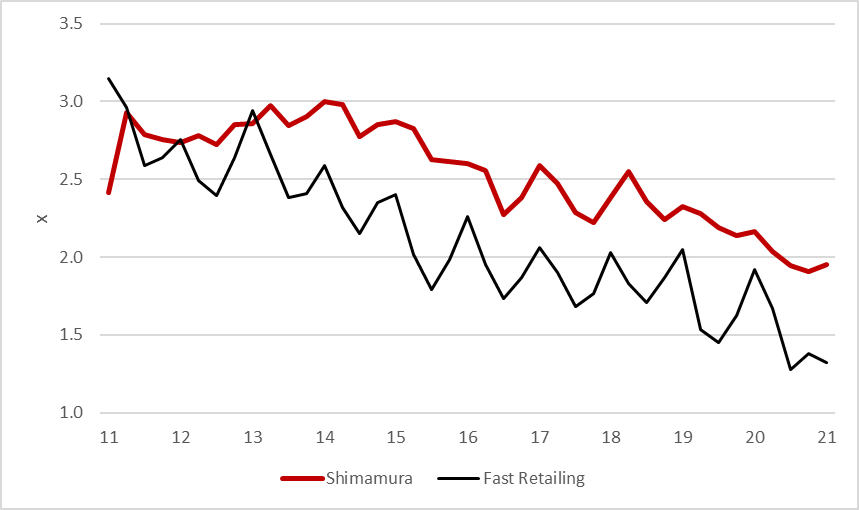
Inventory RoI: Gross Margin x Inventory Turnover
Source: Azabu Research, company data
Under New Management
Shimamura’s board bade and unusual move at the end of February by announcing the retirement of Tsuneyoshi Kitajima as president after only two years, and his replacement by Makoto Suzuki. Prior to Mr. Kitajima, Masato Nonaka had held the position for 13 years, and before him, Shujiro Fujihara held the position for 15 years. The founder, Nobutoshi Shimamura took over the family kimono ship in Saitama in 1953, renamed it Shimamura Fashion Center in 1961, and opened the second store in 1963. By 1990, he had turned it into the most efficient distributor of casual clothing that Japan had ever known at the time.
In other words, since its founding almost 70 years ago, Shimamura has had only four presidents. Managers at Shimamura normally have very long tenures, so the abrupt promotion of Mr. Suzuki was not a routine change. It was an indication that the board was ready to break with very deep-seated traditions to make whatever changes needed to be made to revive the company’s performance.
Mr. Suzuki joined the company in 1989 after graduating from Nihon University, and held leadership positions inside the firm’s distribution, trade, planning, and numerous other divisions. He was responsible for building the company’s world-class distribution system, which moves merchandise from factories in China all the way to the stores in Japan without ever touching human hands. In our view, he’s at least partially responsible for most of the things that Shimamura does well, and now he’s been given the responsibility for fixing the things that the company does poorly.
Cash Flow from Operations and Capital Expenditures
Source: Azabu Research, company data
There was another change in personnel that is less talked about, but probably more important. Despite Shimamura’s strengths in cost control and distribution efficiency, the company has struggled to expand the appeal of its merchandise beyond the initial stack-them-high-and-sell-them cheap concept. The company has repeated several cycles of failed attempts to introduce more private label goods and then retrenching toward more nationally branded goods, which also failed to restore stability, giving the impression that the company lacked the ability to solve its problems. It has been our view that the company lacked managerial talent in the merchandising department-an area that didn’t matter so much in the company’s initial growth stages but has become crucial in today’s retailing environment. We felt the company needed to bring in outside management, but Shimamura’s very traditional Japanese hiring practices prevented the hiring of any mid-career staff from outside the company.
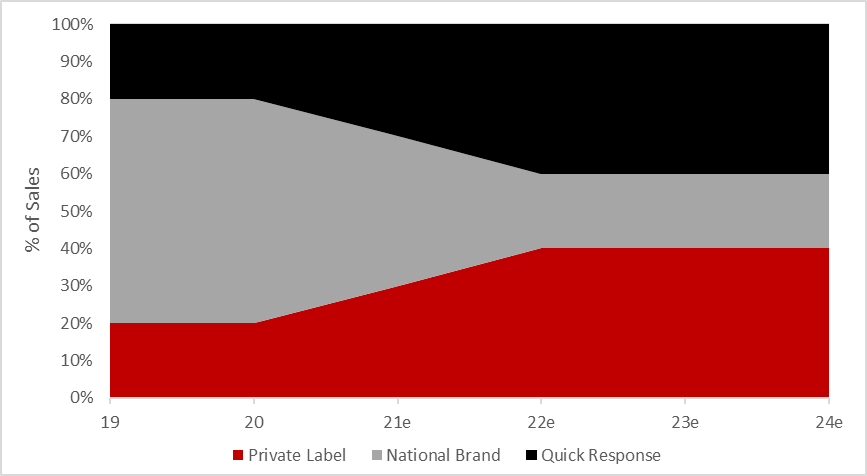
Shimamura chose another path that caught us by surprise, which was to hire an outside consultant to help with market research and merchandise development strategies. The consultants have added consumer research capabilities and have helped the company find and fill significant gaps between their merchandise offerings and the consumer demand. They have helped Shimamura find manufacturing and design partners who could help create the merchandise that filled these gaps. As a result, private label merchandise has already increased to 30% of the merchandise assortment, up from 20% a year ago. Unlike any other previous attempts to increase this ratio, customers are responding positively, and the merchandise is selling at full price. In our view, the hiring of outside marketing consultants is the magic bullet that makes previously unsolvable problems become solvable.
All The Right Changes
With new, more decisive management in place and new knowledge and talent imported from the consultants, the company has put into motion a recovery plan that in our view makes all the right changes, and we are already able to see that consumers are responding positively.
- Increasing the merchandising staff by 10%
- Delegating more pricing decisions to local store managers
- Upgrading the inventory management systems to provide real-time data on sku’s at the store level.
- Launching a new e-commerce channel that could revolutionize the cost structure of e-commerce in Japan
- Converting its entire advertising effort to digital media, eliminating ineffective and costly TV and newspaper adds.
- Hiring outside consultants to identify and fill gaps in the merchandise assortment
- Increasing private label merchandise to 55%, from 20%.
- Redefining the store layout and display strategy to create more excitement and less clutter.
- Re-thinking the inventory strategy to allow hit merchandise assortments to run deeper.
- Expanding the price points to include higher-end items that appeal to age and income cohorts that the company was previously neglecting.
Succeeding, Finally, with Private Label
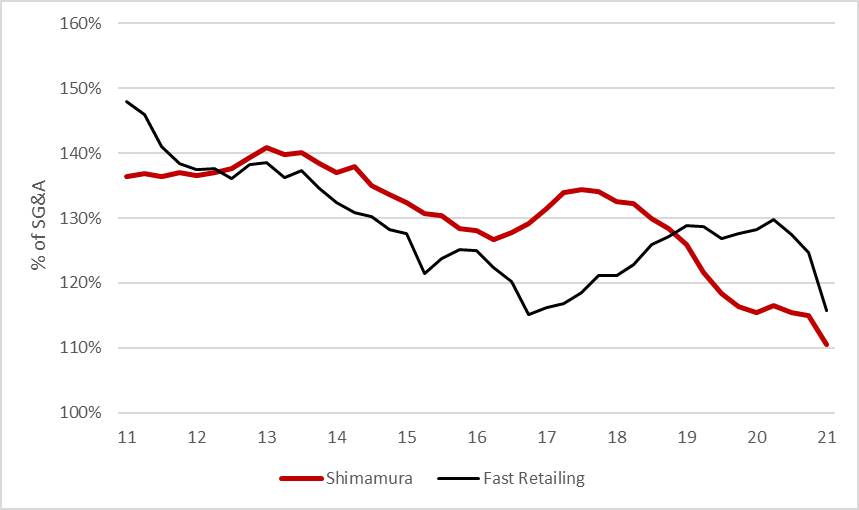
Shimamura’s is unique among the leading Japanese apparel retailers in that it’s competitive advantage is derived from its logistics capabilities rather than merchandising. Where Fast has designers, who create and plan merchandise that will never be available anywhere but at Fast Retailing, Shimamura has buyers who search the world for the best deals. Shimamura can undercut Fast’s prices because it has much lower operating costs and typically caries 4-5 times as many different items in much smaller lots so that a single purchasing mistake has much less impact. The low-risk strategy is also less rewarding, as Shimamura’s gross margin is usually at least 15 percentage points lower than that of Fast. The initial mark-up on private label merchandise is typically about 10 percentage points higher than that of nationally branded merchandise, but only if the merchandise is sold in higher quantities needed to justify the cuts that the manufacturers take. If quantities sold fall below target, prices of private label goods must be cut more aggressively to clear the inventory, and the margins of private label goods can easily end up being lower than those of nationally branded goods. There is no free lunch.
Gross Margin as a Percent of SG&A
Source: Azabu Research, company data
In the past, Shimamura’s attempts to increase gross margin by introducing more private label goods have often met with disaster, so when Shimamura announced plans to increase the private label merchandise to 50% of total sales, it’s not surprising that analysts met this news with a yawn. If this were the only thing that had changed, it probably wouldn’t make a difference. But management has changed the way these items are planned, the way they are made, and the way they are sold. Already, the ratio is up to 30%, from 20% previously, and management says they are consistently exceeding targets, so they are preparing to ramp the ratio up further.
The most important change, in our view, is that management has hired outside consultants to conduct market research and identify unmet consumer needs and then to plan for specific types of merchandise to meet those needs. We think the company’s internal capabilities were never going to be able fill this function and this a large reason why so many of the private label initiatives failed in the past.
The second important change is that rather than send buyers out to find the appropriate merchandise, they are hiring outside designers to create collaborative merchandise lines – economically, it’s the same as a private label, except that they use someone else’s label, and they plan the merchandise rather than buy off the rack.
We will address the third important change in the next paragraph, but a crucial data point in our assessment is that the company sees encouraging data that demonstrates consumer is already responding favorably to these changes. The new merchandise lines are a key reason that Shimamura’s spend per customer has been rising as much as 10 percentage points faster than the apparel industry average in recent months. This is no longer theoretical. It’s working in the real marketplace.
Why Store Design is So Important
Marketing a successful private label product is so much more than designing and purchasing the inventory. Take Fast Retailing’s HeatTech line of thermal underwear or Nitori’s line of N-cool merchandise that feels cool to the touch. Neither of these products were invented by the retailers – they only own the name. Shimamura in fact sells a comparable line of each, made by the same manufacturers, and just called something else. But at the Fast and Nitori stores, you see massive displays deigned to grab attention and explain why you need to buy these products. You see massive amounts of inventory on the shelves which tells you that the company intends to sell a lot of these products.
Shimamura employs a treasure-hunt approach to its store designs. You must know what you are looking for and you must want to find it. There are advantages to this approach. In contrast with Fast Retailing or Nitori shoppers, the Shimamura shopper is far more likely to be a housewife who wants to believe she is earning her discounts and is willing to spend more time in the store. The store costs much less to maintain because things that are out of place don’t necessarily look out of place.
But the disadvantage is that you can’t sell high volumes of the same items. Every customer coming to the store is going to leave with something different. This is the reason Shimamura focuses on larger numbers of items and much smaller lots than either Nitori or Fast. It’s why no one has ever heard of Shimamura’s equivalent to Fast’s “HeatTech,” or Nitori’s “N-Cool” even though they are made from the same material by the same manufacturer.
This is also why we think the company’s store remodeling is so important. Without altering the underlying “treasure-hunt” concept, Shimamura has been cleaning up its stores by reducing the number of brands, increasing the aisle space, and spending more money on display art designed to encourage higher spending per customer. Management has already remodeled 50% of its outlets and expects to have completed 80% by the end of August.
Now, when Shimamura launches a new collaborative merchandise line or private label, they can focus the attention of every customer on this one segment of the store, so the ability to handle private label merchandise successfully should increase. This is more than just theory. Management tells us real-time point of sale data is confirming that the new approach is working.
Shimamura is also transforming the way it promotes its merchandise that is leading to lower costs, faster speeds, and higher sales. By the end of this year, we think management will have eliminated most of its newspaper and television advertising, converting to almost entirely digital advertising. The company has always had a strong presence in social media, even enough to lead to coinage of new words, like “Shima Patoro”, a designation coined by customers, for customers, who posted pictures of new items in stock while on “patrol” at a Shimamura outlet. But this was mostly fun-and-games compared to the latest approach, which effectively replaces all previous media. Management claims they are able to time events more precisely to shifts in consumer demand, leading to larger impact, less wasted effort, and smaller budgets.
Whereas a television commercial might take 6-8 weeks to plan, create, and execute, a digital campaign can be launched within days. If the company expects a heat wave in the next week, they can respond with targeted adds in a way that was never possible before.
Revolutionizing the E-Commerce Platform
Shimamura’s greatest weakness, at least in recent years, has been the almost total lack of exposure to e-commerce. We think this is about to change in such a dramatic way that it could disrupt the entire apparel market.
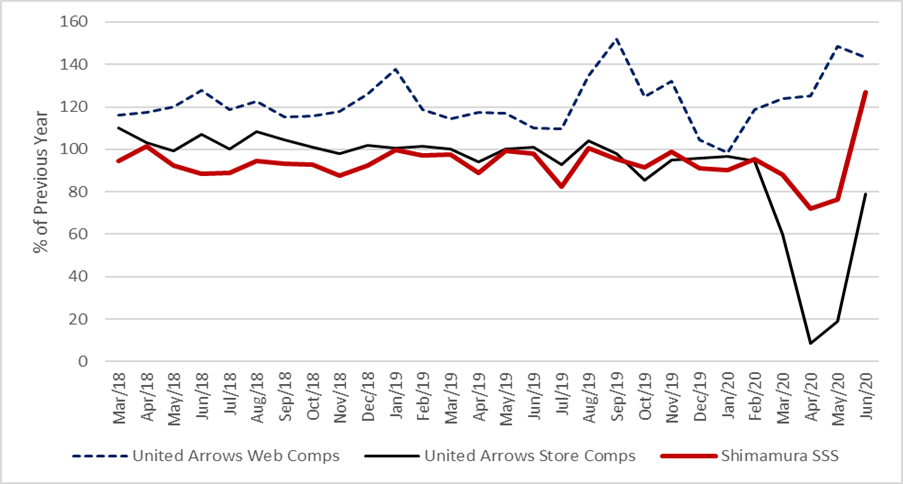
We believe there is no major apparel retailer in Japan that could have achieved any growth in revenues during the past three or four years without aggressive investment in e-commerce. So, when Shimamura’s persistently weak SSS are compared to any other apparel retailer in Japan, it is not precisely a fair comparison. Shimamura’s sales are entirely off-line, while other apparel chains derive on average about 10% of their SSS from off-line sites, and the strongest apparel retailers often generate more than 20%.
Only one other apparel retailer consistently discloses monthly data by channel: United Arrows. UA’s average price points are probably 5-10x higher than Shimamura’s, so the comparison must be made carefully, but we think it is nonetheless informative. Prior to the Covid-19 outbreak, UA reported SSS consistently higher than the apparel retailer industry average, while Shimamura’s comparable store sales were consistently weaker. However, if we strip out the e-commerce component, as shown in chart 8, UA and Shimamura’s off-line SSS trends were remarkably similar.
Merchandise Assortment by Procurement Method
Source: Azabu Research, company data
Most apparel retailers who use the internet as effectively as UA are replacing high store operating costs with high delivery and web-service costs. This approach works better in Japan, perhaps, because average store costs are typically higher than in other countries, and total delivery costs are typically lower. Unfortunately, for Shimamura, this approach was never available to Shimamura because its store costs are massively lower than those of most other apparel retailers. So much so that the internet channel cannot compete on cost.
Shimamura’s gross margin is consistently about 20-percentage points below the industry average – an insane disadvantage that is compensated by an even more insane advantage in store operating costs that are typically only half that of the average rival. Combined with the Japanese industry’s lowest rents and one of the world’s most efficient distribution systems, Shimamura’s off-line economic moat is probably impenetrable. Unfortunately, the off-line business can’t grow, and the on-line business model isn’t viable because Shimamura’s gross margins cannot cover the cost of the traditional e-commerce model.
Enter BOPIS, the new industry buzzword for Buy Online, Pick-up In Store. It’s not new but is growing in popularity. This fall, Shimamura will launch a self-contained e-commerce platform that we think will not only resolve this problem but could cause disruption throughout the entire e-commerce industry and drive Shimamura back into the top ranks of growing apparel companies.
Shimamura will essentially use its existing store distribution system to eliminate about 50% of the traditional costs of an integrated e-commerce channel. The company expects about 70% of its customers will elect to pick-up items instore rather than pay the extra fee they plan to charge for home-delivery. The company plans to outsource the remaining transportation and packaging requirements for a fraction of the typical costs in the industry because the merchandise will already have taken a ride on the company’s existing conveyor belt for more than 90% of the distance it needs to travel.
With the launch of this system, we think Shimamura has finally turned the chronic disadvantage into a strength that probably no other retailer in Japan can replicate. With 1,400 neighborhood outlets and a totally automated distribution system from ship to store already in place, Shimamura needed only to build one special purpose distribution hub as an additional wing to an existing facility. Adding state-of the art picking and sorting equipment brought the total investment to only ¥1bn.
Shimamura and United Arrows SSS by Channel
Source: Azabu Research, company data
Fixing the Regional Weaknesses
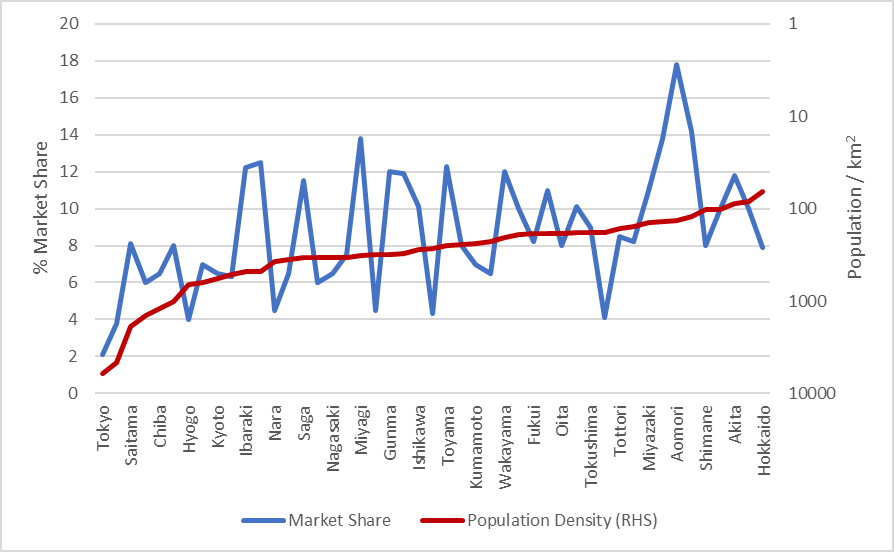
Shimamura has held a dominant market share of its core merchandise assortments for more than 20 years, but the company would argue there is still tremendous room for expansion. Management estimates that total domestic market for goods carried in Shimamura’s Fashion Center outlets to be about ¥8.4trn, which indicates Shimamura’s nationwide share is about 6%. Management’s estimate of share by prefecture shows significant variance, anywhere form 2% in Tokyo to 18% in Aomori. The company’s argument is that if they can achieve 18% in Aomori, why not Tokyo?
To date, our concern has been that the inverse correlation between Shimamura’s market penetration and population density was not an accident but rather the result of the company’s strategy of reliance on real estate market anomalies rather than on merchandise to gain a commercial advantage over rivals. Real estate anomalies are likely to be more difficult to exploit in densely populated regions, simply because there is more competition and properties are more likely to be efficiently priced. In higher rent districts, Shimamura’s advantages in turnover are likely to be reduced, and its disadvantage in gross margin could become prohibitive.
However, chart xx below shows that population density is far from the only factor that determines market share. While an 18% share in Aomori might not guarantee an 18% share in Tokyo, it might mean that a doubling of share is possible in many other prefectures without changing anything other than the store numbers. If, in addition, Shimamura can solve its internet problem and improve its merchandise assortments as discussed above, then it should become much easier to increase penetration in regions where Shimamura is weak.
Market Share & Population Density by Prefecture
Source: Azabu Research, company data
Fixing the Secondary Brands
Shimamura’s diversification efforts pose the most significant challenges, in our view. The company’s secondary brands are mostly attempts to address markets with higher price points than its core business. Theoretically, it should be possible to expand in this way without cannibalizing the core brand, but after 23 years of trying, Shimamura has yet to make this work.
In our view, these businesses should all have been discarded years ago, but an ineffectively incentivized management has neither been able to make the decisions needed to turn these into viable operations, nor to cut their losses and exit the businesses. We are hopeful that new management will be in a better position to make the right decisions.
In our estimation, non-core brands lost ¥5bn in the year to 2/20, so elimination could improve operating profits by about 25%. Of course, turning them into profit drivers would be even better, but management needs to give itself a deadline for clearing hurdle rates, and then, if it fails to meet that deadline, it needs to disinvest.
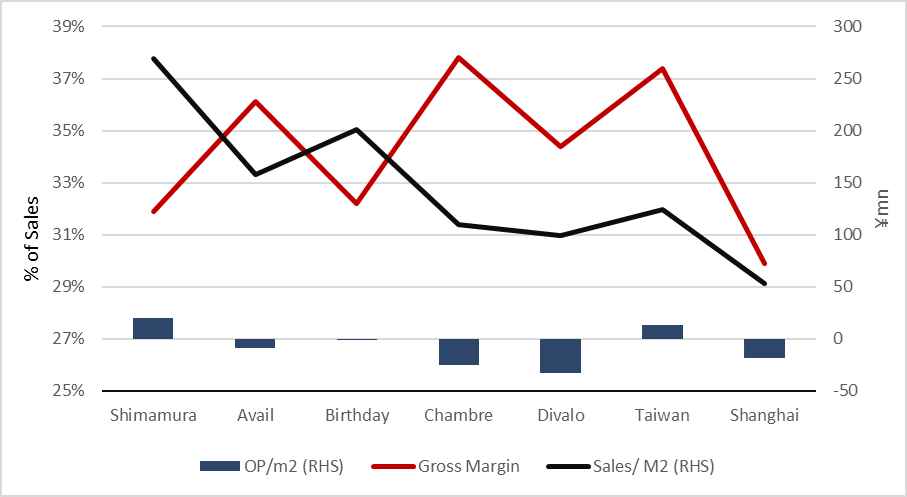
There are three domestic brands and two overseas subsidiaries. Avail is a chain of clothing outlets focusing more on younger women. The price points are about 1.5x those of Shimamura. Target gross margins are about 400bps higher than Shimamura, but turnover has never reached management targets and profitability remains elusive. Recently, Avail’s gross profit per square meter was only about 55% that of Shimamura.
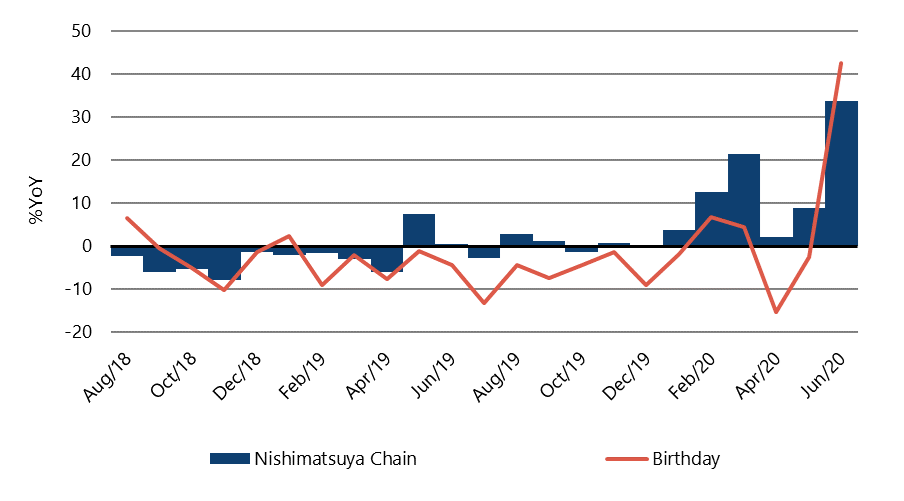
Birthday, the mostly rapidly growing brand in the group, is a 297-outlet chain of clothing and accessory shops for babies and young children. Compared with Nishimatsuyachian (7545 JP), Birthday claims to offer higher quality and higher price points. Compared to Akachan Honpo, owned by Seven&I (3382 JP), management claims to operate stores that are smaller and easier for young mothers to shop with their children in tow. It’s gross profit per square meter is only 71% of that of the core brand.
Chambre is a chain of 93 outlets focusing on home furnishings, while just 17 outlets of Divalo offer casual footwear. Both chains generate less than half the gross profit per square meter as the core Shimamura brand.
Operating profits of these brands are not disclosed, but it is impossible to believe that the store operating costs are as low as the core brand, which means that none of these chains are even close to break-even despite generating higher gross margins.
In our view, for these secondary brands to be successful, the incremental shift in price points that management tried to achieve would require a giant leap in core branding skills. Management’s original plan was just to pile up different merchandise assortments into the same locations with the same selling and distribution strategies. In our view, this was never going to work the way they originally conceived it.
The key to fixing these brands is improving the turnover rates. As shown in Chart x, most of the secondary brands earn higher gross margins than the core Shimamura brand but generate insufficient turnover to cover our estimate of their costs.
Gross Margin and Selling Area Efficiency by Brand (FY2/20)
Source: Azabu Research, company data
Fixing Avail
At the current rate of growth, Birthday will probably clear this hurdle in the current term, and the size of the other subsidiaries is still trivial, leaving Avail as the only serious problem. Fixing Avail will be difficult, but it can be done.
If we assume that Avail has the same overhead costs per square meter as the core Shimamura stores, then Avail needs to either increase gross margins by more than 200 basis points and increase sales per square meter by about 13% just to break even.
Management has shifted strategies multiple times between an emphasis on higher margined private label merchandise and higher turnover, more stable margined national brands. Neither approach has ever worked, in our view, because management had defined its market niche too narrowly. The low-rent districts that management prefers are in areas with lower population densities. Retailers who succeed in such locations tend to define their target consumer as “everyone.” Niche retailers tend to need higher-density areas because they appeal to a lower percentage of any population. Shimamura’s original plan was to increase the specialization slightly, and to compensate for the slightly lower traffic with slightly higher gross margins. To be fair, very few retailers ever manage this kind of diversification successfully. In the case of Avail, the decline in traffic was more than slight. We see this kind of miscalculation happen all the time when retailers try to diversify.
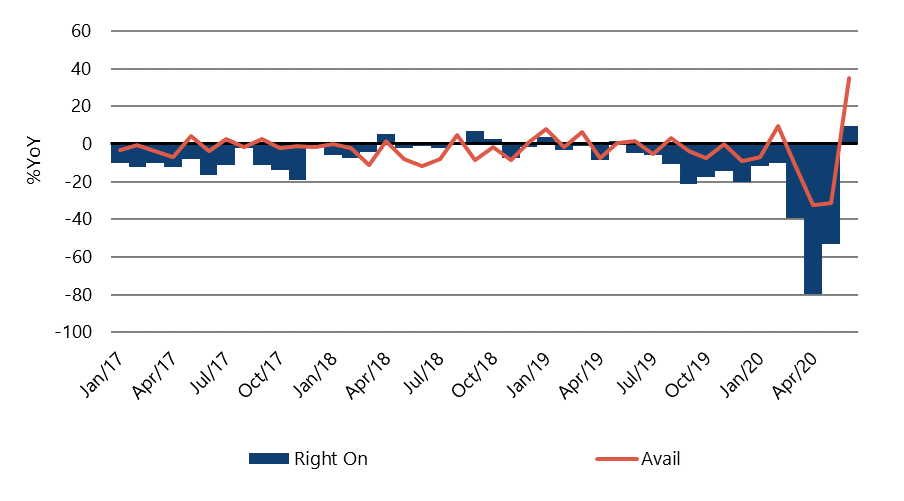
There is a way to fix Avail, and we think the new management is on the right path. The company has expanded the target consumer by greatly increasing the weight of basic casual wear. This brings them into direct competition with much larger Fast Retailing, but they differentiate by being slightly more fashion forward and offering more sophisticated color schemes. They have also applied the same remodeling concepts used in the Shimamura outlets to reduce clutter and increase excitement for the new merchandise. There is some preliminary evidence that the plan is working. Even before the pandemic, Avail was achieving the highest gross margins in the brand’s history, and in the first month after nationwide emergency lockdowns were lifted, Avail’s sales rose 37%. No doubt this included an element of revenge shopping, but Avail’s sales growth was the highest among more than a dozen apparel retail chains who publish monthly numbers. Management claims that both margins and sales are rising – a combination Avail has rarely achieved before. The revenge element may not be sustainable, but we think the change in merchandise should help Avail to sustain above average growth in sales and margins.
We also think Avail’s customer base is likely to respond more favorably to the company’s web-site launch. Although Avail is not expected to participate in the first year, a viable e-commerce channel would enable Avail to reach more of the customer base it seeks without investing in expansion of high-rent locations that it would probably need otherwise. If Avail can reach industry average levels of e-commerce penetration, then it can become profitable. Once it is profitable, expect management to expand the chain and improve its economies of scale, further improve its merchandise assortments, and perhaps even become a profit driver.
Avail SSS vs Right-On
Source: Azabu Research, company data
Chart 11 shows Avail’s monthly same store sales growth relative to Right-On, another retailer focused on casual wear, focused on suburban locations. Notice that Avail’s sales did not decline as much as Right-On’s during the pandemic, yet Avails growth in the immediate recovery, so far, appears to be stronger. It is possible that this reflects a shift in consumer preferences toward lower price points, but Right-On’s traffic patterns are similar to those of Avail. The difference is in spend per customer, which we think is an indication that the changes in Avail’s store design tactics and merchandise assortments are probably having an impact.
Birthday SSS vs NishimatsuyaChain
Source: Azabu Research, company data
Getting Out of China
Most foreign retailer sin China have focused on the wealthiest segments of the population, while we feel the larger opportunity may be in the middle-class segment. This would seem to be a natural target for Shimamura, since 80% of its merchandise is manufactured in China. The company should already have the connections and the buying power that it would need to at least get started.
It’s a little more complicated than that.
Shimamura’s advantages in Japan are first and foremost in the real estate and distribution areas and have little to do with the merchandise or the marketing strategy. In Japan, Shimamura exploits inefficiencies with great power and finesse, but in China, it has persistently found itself on the exploited end of the real estate transactions. Initial locations were too urban and the company found itself paying higher rent than it pays in Japan despite significantly lower turnover. Then the company tried moving to the suburbs but found too many of its locations were inside the famous Chinese ghost towns that were built for investment purposes without any actual residents. Local retailers quickly vacated these areas leaving Shimamura open for business in otherwise empty malls. If the company moves further out into the countryside, apparel markets are still dominated by bazaars and management does not believe it can compete on price in these markets. Management has begun to retrench, which is good. We think they need to complete the process by exiting the China market.
Taiwan, on the other hand, is Shimamura’s only successful diversification to date. The demographics and the terrain are more like that of Japan, and thus, much easier for Shimamura to penetrate. Turnover is lower per square meter than the domestic brand, but overhead costs are also similarly lower so that the brand is most likely profitable.
Wind at Their Back
Turnarounds are always easier when external factors are favorable, and in this sense, Shimamura’s timing could not have been more propitious. Without exception, retailers tell us that they detect an underlying shift towards lower-priced goods across all merchandise lines. Whenever possible, there is an increased preference for buying casual wear or household goods, and a preference for shopping closer to home rather than at large centralized shopping districts.
As we discussed in the initial paragraphs of this report, there is probably no retailer in Japan in a better position to capitalize on the trend toward lower prices, more casual wear, and more suburban locations than Shimamura.
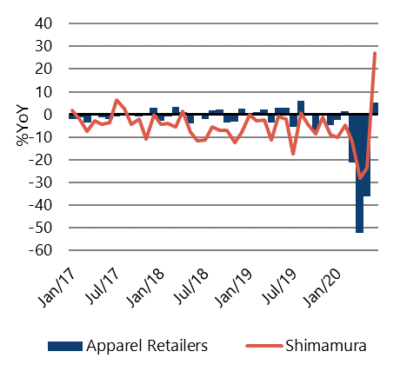
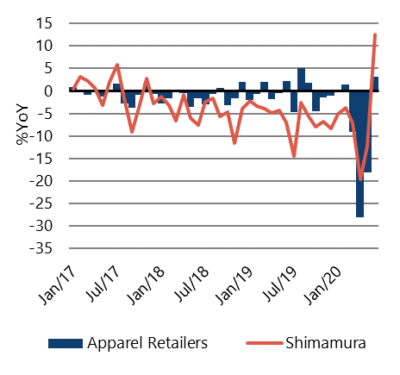
After several years of persistent underperformance, Shimamura’s monthly same-store sales have grown faster than the average apparel retailer in each of the past three months. In June, same store sales rose 27%, compared to an apparel industry average of just 5.1% (Please see chart x). The gap cannot be explained by low hurdle rates; Shimamura’s 2-yr average sales were up 17.5%, compared to an industry average of only 3.1%.
Chart 13 shows the percentage year-on-year change in same store sales compared to other apparel retailers. After underperforming consistently for more than two years, Shimamura began to outperform in March as the pandemic spread. Many observers will attribute the change to Shimamura’s suburban locations, which were less subject to lockdowns and to the predominance of low-end casual wear in Shimamura’s merchandise mix. There is no doubt that Shimamura benefited from a shift in consumer preferences, but Shimamura’s sales growth has also outperformed other stores who benefit from the same trends such as Fast Retailing, Nishimatsuyachain, and Right-On.
Shimamura SSS vs Peers
Shimamura 2Yr Avg SSS vs Peers
Source: Azabu Research, company data
Source: Azabu Research, company data
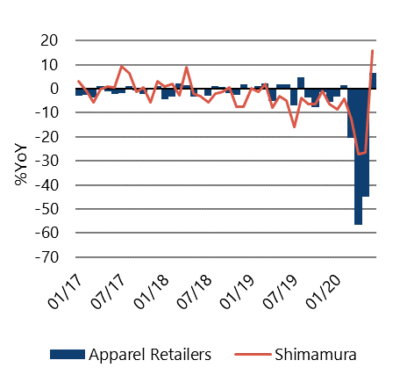
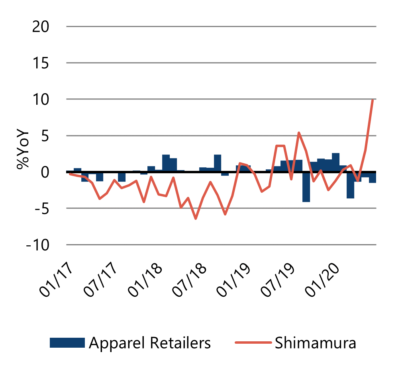
The main reason we are encouraged to believe this nascent recovery is caused by internal changes is that both customer traffic and spend per customer are up double digits, while the average apparel retailer is still seeing declines in spend per customer. The spend per customer started to outperform in March when new merchandise lines were first introduced. External factors cannot explain either the degree of change or its persistence.
Finally, if we look at the break-down between consumer traffic and consumer spend, we see more clearly why the change has occurred. All apparel retailers are enjoying a huge recovery in customer traffic in June, but most saw a decline in spend per customer. Shimamura not only saw significantly higher gains in traffic, but also a 10% increase in spend per customer. We believe this is strong evidence that Shimamura’s new store layouts and its new merchandise assortments are resonating with consumers. This cannot be entirely a result of external factors, and to the extent that it is internally generated, it should prove sustainable.
Customer Count vs Peers
Customer Spend vs Peers
Source: Azabu Research, company data
Source: Azabu Research, company data
Consensus is Oblivious
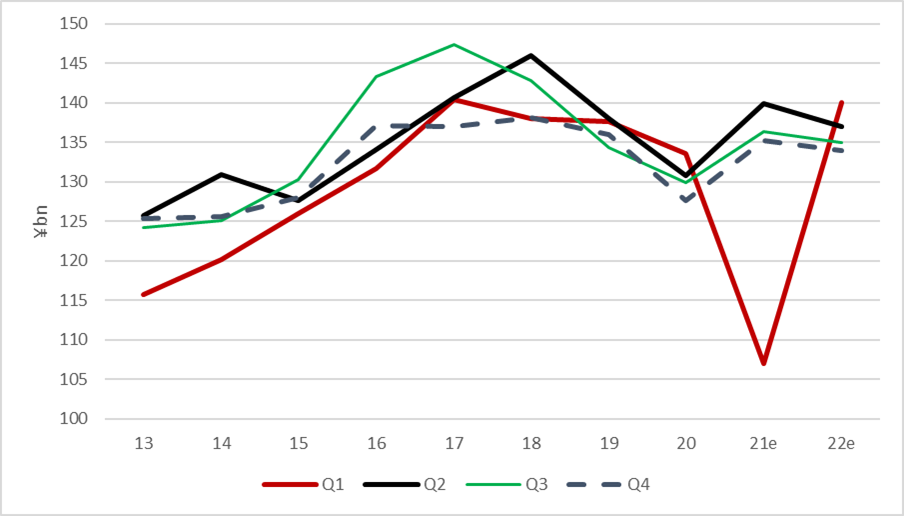
We think both the quarterly and multi-year consensus estimates are far too low. Consensus expects a 20% decline in operating profits on a 4% decline in sales for the current year, yet we already know that June sales were up 27% and other brands were even stronger. Longer-term consensus forecasts assume that the company’s current year guidance is never met even 3-4 years from now.
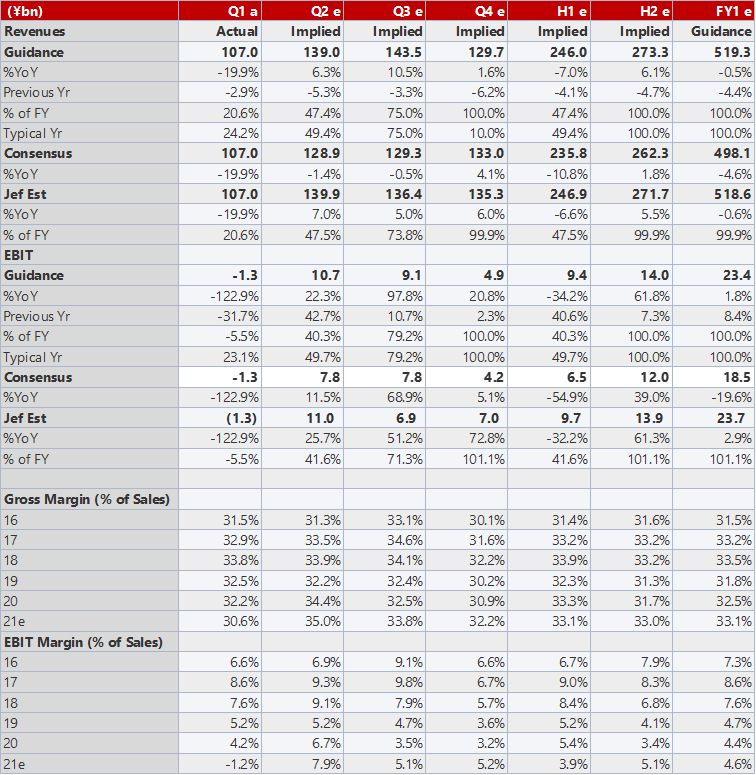
Quarterly Estimates vs. Consensus
Company guidance implies that during the remaining two months of the quarter, sales will drop more than 4% compared to the same months a year ago. Consensus estimates imply a 16% drop. Even if one assumes that the improvements in June were 100% driven by external factors, the current consensus forecasts seem outside the range of plausible outcomes. Our Q2 forecast assumes a 3% year-on-year decline during the next two months, but we believe this to be a worst-case scenario.
Sales by Quarter
Source: Azabu Research, company data
The company’s guidance implies a second-quarter operating margin of 7.7%, while consensus anticipates only 6%. Historically, the second quarter OP margin has averaged 7.4%, and given the increase in private label merchandise and the likelihood that sales exceeded targets, the consensus bearishness on operating margins is incongruous. We think the operating margin will be closer to 8%.
Consensus estimates imply less than 2% sales growth in the second half. Sell-side analysts are noticeably concerned about higher growth rates recorded by Shimamura in the second half of last year, but we think the use of hurdle-rates can lead to bad forecasts. The year-on-year growth rates are volatile and forecasting in any environment is susceptible to large errors, but the month-on-month, seasonally adjusted growth rates are very stable. We think we get better forecasts by converting the year-on-year growth rates to an index level and projecting forward based on monthly seasonally adjusted norms. Based on this approach, even accounting for revenge shopping in June, we think the company has already cleared the levels of volume that render last year’s hurdle rates much less formidable than the consensus assumes. Our forecast assumes a 2% contribution from the new e-commerce channel and a 2% rise in same-store sales, plus 1.5% from new stores.
Company guidance implies a 5.1% operating margin in the second half, while the consensus forecast implies only 4.6%. Historically the company averaged 6% in the second half but achieved only 4.1% or less in the most recent two years. This level of skepticism by consensus is unusual and is probably a reflection of how bad the previous management was at forecasting. Nevertheless, we think it is paramount that we recognize the change that has taken place. The new management is looking at daily sales and margin data and seeing consistent outperformance of targets. Our forecast, which mirror management’s, should be viewed as conservative.
Quarterly Operating Data and Forecasts
Source: Azabu Research, company data
Annual Estimates vs. Consensus
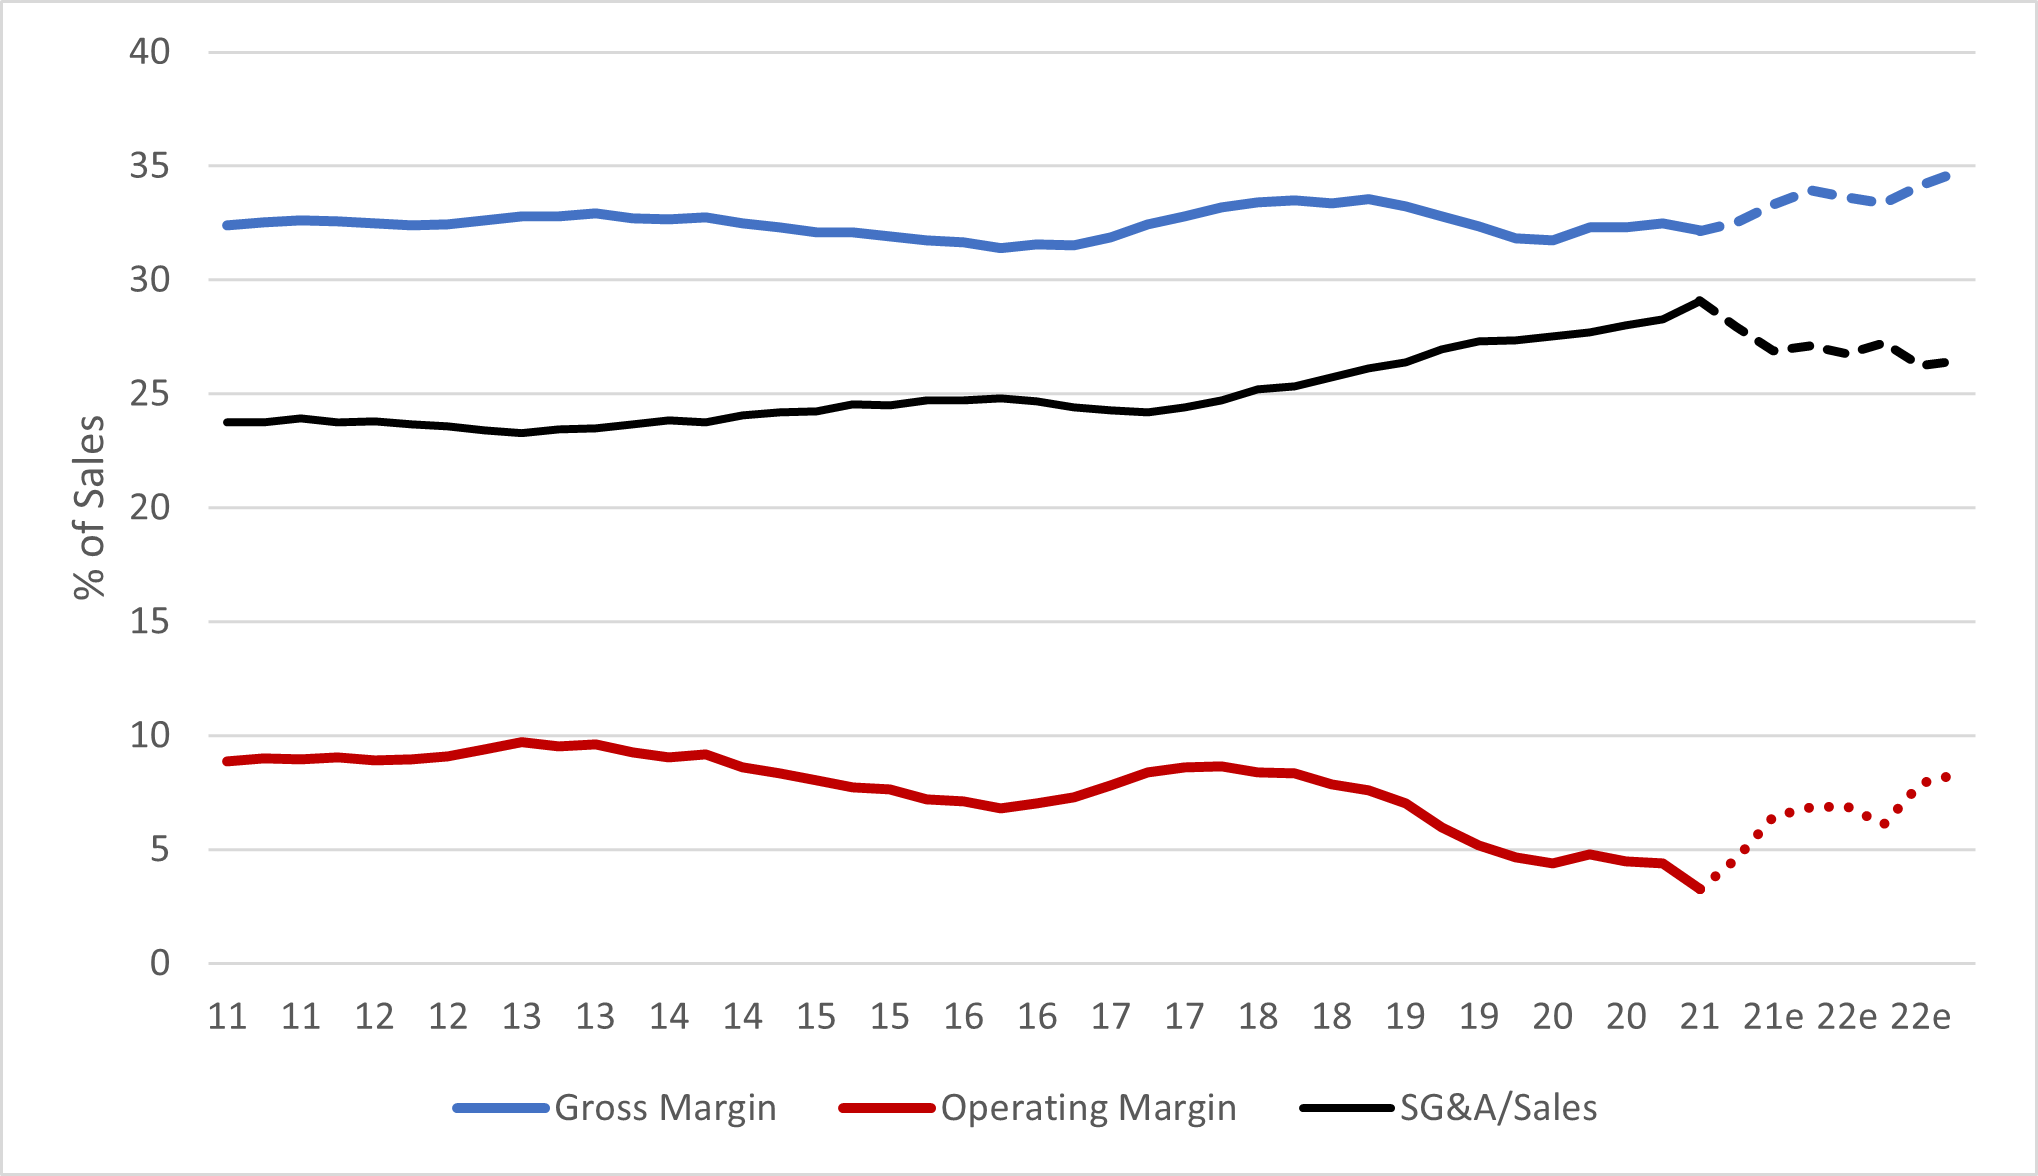
While the consensus near-term forecasts appear overly skeptical, the longer-term consensus numbers not even credible in our view. Consensus expects operating profit to remain flat indefinitely, while we see OP rising 16% annually on 4% growth in revenues. We do not think our forecasts are aggressive. Chart 17 on the previous page showed that we don’t ask for the quarterly sales to exceed peak levels at any time in the next two years. Chart 18, below, shows that we anticipate only modest improvement in gross margin and SG&A to sales ratios. The consensus forecast indicates a complete rejection of any idea that any of the many changes that have taken place can have any impact on Shimamura’s future. If only one or two changes had taken place, this might count as healthy skepticism. When so many changes have taken place, the skepticism goes against the laws of normal probability. When evidence is already available indicating that the changes may already be having a very profound effect, then skepticism becomes imprudent.
Operating Margin Attribution (Seasonally Adjusted)
Azabu Research, company data
Deep Value Keeps Getting Deeper
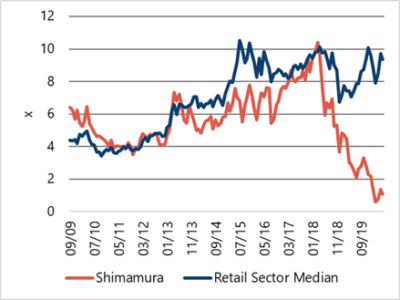
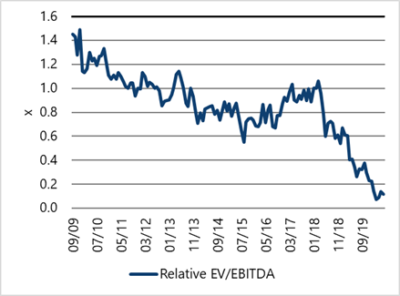
Shimamura has underperformed the median retail stock by 50% since peaking in 2/17, and by 75% since its all time high posted in late 2009. However, until the spring of 2018, the underperformance was mostly a result of sub-par growth. Declines in sales and margins only started in 2018. The company’s EV/EBITDA dropped from its peak of 10x, which was in-line with the retail industry average at the time, to the current rate of just 1.1x while the sector average is still about 9.4x. This implies that stakeholders have a required rate of return of 90% per annum, compared to only 11% for the rest of the sector. Prior to 2017, Shimamura traded on multiples of earnings, cash flow, and book value that were in-line with the sector median. If the company achieves even half of the improvements we are expecting, it would be reasonable for the company’s multiples to return to normal valuations with the sector. It’s not impossible for the stock to trade at a premium.
EV/EBITDA: Shimamura & Peers
Relative EV/EBITDA
Source: Azabu Research
Source: Azabu Research
What Could Prove Us Wrong
No investment ever goes exactly according to plan, but in Shimamura’s case, we think most of the potentially negative scenarios are highly implausible. The upside risks are orders of magnitude larger than the risks that we can imagine.
Probably Not a Value Trap
Most investors believe that Shimamura is a value trap – a stock that becomes cheap for a valid reason, and then just stays cheap for equally valid reasons. Shimamura has earned this label. On a PBR basis, it began to trade at a discount in 2010 and the discount just kept expanding persistently for most of the past 10 years. Companies don’t usually become value traps for lack of effort. There is always a recovery plan. Shimamura has had several that didn’t work and didn’t have any chance of working. Statistically, value traps probably happen more often than turnarounds, so it is appropriate to assume that a cheap stock is a value trap until proven otherwise.
But if you know the differences between plans that can work and plans that cannot, you can make a lot of money before most investors even know what happened. We think Shimamura’s plan finally checks all the right boxes.
The consensus position implies not only that the changes in Shimamura’s relative sales performance can be explained entirely by external factors and nothing the company has done or will do can have any impact on the future. If the consensus is right, then Shimamura is likely to be a value trap, but we find this proposition to be far-fetched.
Probably not a Return to Normal
Some will argue that we are over-reacting to a single month’s sales in June, and that once consumers return to normal consumption patterns, they stop needing the so-called “stay-at-home” goods that Shimamura has excelled at selling in recent months.
In our view, investors often make a huge mistake by attributing a retailer’s success or failure to a specific merchandise line. Retailers change their merchandise lines, and as an outsider, you have no idea what merchandise they are going to be selling 6 months from now, let alone 2-3 years from now. Long-term returns, therefore, are never about the merchandise. Instead, you should always focus on the process that retailers use to deliver the right merchandise at the right time and the right price. In Shimamura’s case, they’ve benefitted from the “stay-at-home” boom because they planned on benefitting from it. As we have detailed in this report, Shimamura has changed the way they plan and procure merchandise, and consumers who come to the store are buying in higher quantities and at higher prices than before. We’ve compared recent results to other retailers competing in the same space and showed that they are not benefitting as much, and that this difference is new. This doesn’t’ qualify as proof that the company can succeed when consumption returns to normal, but it is about the best evidence you can get. Letting the lack of proof get in the way of evidence this strong is never a good idea in our view.
One could argue that Shimamura is not the most geared play to a full recovery in consumer traffic and consumption. There are a lot of companies with lower break-even points and much higher price points that would likely catch a stronger wave at the beginning of any upturn. But we would argue that what Shimamura lacks in operational gearing, it more than makes up for in extreme undervaluation. We think Shimamura’s combination of critical internal reforms and extreme undervaluation can probably compete with almost any cyclical recovery concept in the short term and achieve much more in the long-term.
Probably Not a Covid Relapse Either
While the market is excited about an eventual reduction in Covid-19 cases and a re-opening of most retail facilities, there is still no approved vaccine yet and these re-openings could well prove pre-mature. We have no idea whether the Pandemic has been defeated or not, but it seams clear that any relapse would probably hurt Shimamura less than it hurts most other retailers. We’ve already seen that in a partial lockdown, Shimamura just performed better because fewer of its stores were affected. In a total shut-down scenario, we estimate that Shimamura’s cash on hand is adequate to pay all fixed cash operating expenses for more than 400 days.
Probably Not a Margin Surprise
It’s not too uncommon to see retailers post superior monthly sales growth only to find out later that the company was advertising excessively or slashing prices to move inventory. Shimamura’s management has made it clear they are doing the opposite. Mark-down losses should be declining, and advertising expenses are being reduced. The company’s salaries are competitive, so they have much less pressure on wages than most of their peers, and there’s no expansion in selling area, so rent might even be declining.
The only way a negative margin surprise can happen, in our view, is if the new merchandise lines start to fail again, leading to unplanned expansion of mark-down losses. Consensus forecasts imply that the current success the company is starting to enjoy is assumed to be a fluke and that merchandise failures will be as frequent as or perhaps even more frequent in the future than they were in the past. These are not reasonable assumptions in our view. The company has made changes that reasonable analysis would suggest have a good chance of working. We have data indicating that the changes are indeed having an impact. Analysts need to update their opinions, and when they do, the stock’s valuations should change.
Financial Statements and Forecasts
Income Statement and Forecasts
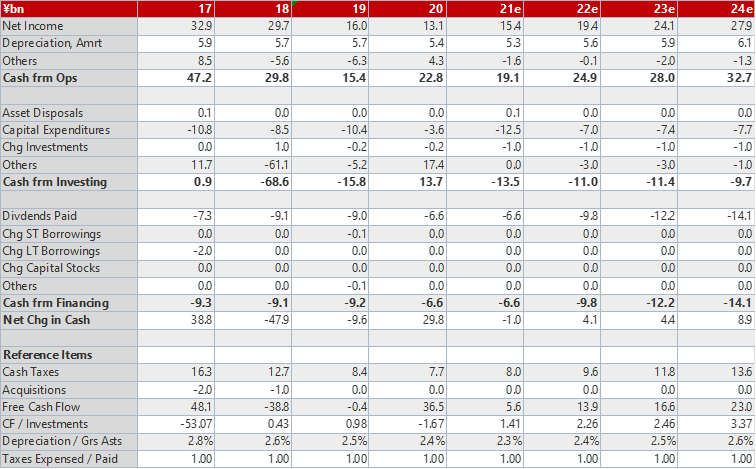
Source: Company data, Azabu Research
Balance Sheet and Forecast
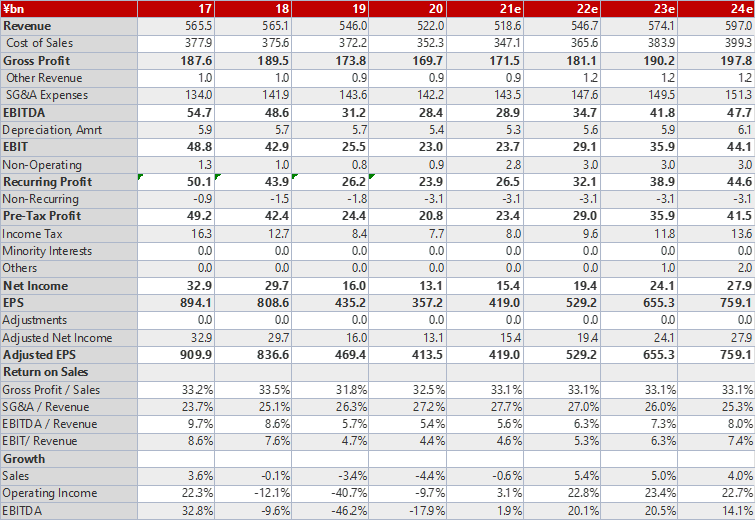
Source: Azabu Research, company data
Cash Flow Statement and Forecasts

Source: Company data, Azabu Research
Key Ratios and Forecasts
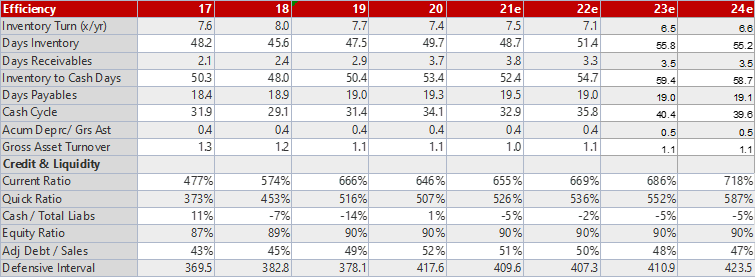
Source: Azabu Research, company data
Disclosures
Analyst Certification
I, Michael Allen, in my role as analyst, hereby certify that the views about the companies and their securities discussed in this report are accurately expressed and that I have not received and will not receive direct or indirect compensation in exchange for expressing specific recommendations or views in this report.
Legal Disclaimer
Azabu Research is not a securities company registered by the Financial Services Agency of Japan, and reports produced by the company, either as part of the Tokyo Turnaround Letter or otherwise, are not an offer or solicitation of an offer to buy or sell any security or derivative instrument, or to make any investment in any jurisdiction.
Azabu Research and the Tokyo Turnaround Letter provide a market intelligence service designed to help investors make informed decisions. The Tokyo Turnaround Letter is designed to aid in the discovery process of securities that may be poorly covered by traditional information sources, and publication of any report on any company does not imply that any additional or follow-up research will be conducted. Neither Azabu Research nor the Tokyo Turnaround Letter has any obligation to inform you when information or opinions change.
Reports based on publicly available information that Azabu Research believes to be reliable but makes no representation or warranty that such information is accurate or complete. Investments in securities may pose significant risks due to the inherent uncertainty associated with relying on forecasts of various factors that can affect the earnings, cash flow, and overall valuation of a company. Any recipient of this research should consider obtaining independent advice specific to their personal circumstances before undertaking any investment activity.
Aston Research, its directors, or employees may have investment in securities or derivatives of securities of companies mentioned in this report and may trade them in ways that could seem inconsistent with the contents of this report.
The value of and income from your investments may vary because of changes in interest rates or foreign exchange rates, securities prices, or market indexes, operational or financial conditions of companies or other factors. There may be time limitations on the exercise of options or other rights in your securities transactions. Past performance is not a guide to future performance. Estimates of future performance are based on assumptions that may not be realized.
Azabu Research personnel conduct site visits but are prohibited from accepting any payment or reimbursement by the subject company for trave expenses for such visits. No employee of Azabu Research has been employed by the subject company anytime in the past 5 years.
The trademarks and service marks contained herein are the property of their respective owners. Third-party data providers make no warranties or representations of any kind relating to the accuracy, completeness, or timeliness of the data they provide and shall not have liability for any damages of any kind relating to such data. The report or any portion hereof may not be reprinted, sold, or redistributed without the written consent of Azabu Research. This publication is intended only for the use yb the recipient. The recipient acknowledges that all research and analysis in this publication are the property of Azabu Research and agrees to limit the use of all publications received from Azabu Research or the Tokyo Turnaround Letter within his, or her, own company or organization. No rights are given for passing on, transmitting, re-transmitting, or reselling the information provided.
